Insights Why the U.S. Leads the Way in Asset Allocation Strategies
By: Jamie Zendel, FRM
Date: 5/16/2025
While recent volatility in the U.S. financial markets has captured the spotlight, leading investors to potentially look elsewhere we believe that the U.S. still offers the deepest capital markets and the best investment opportunities in the world.
The charts below highlight factors that have driven, and continue to drive, the view by Capital Management to remain overweight in our U.S. allocation strategies as compared to our Europe, Australasia, and the Far East (EAFE) strategies.
Long-Term Outperformance in U.S. vs. EAFE
- U.S. equity returns have significantly outpaced EAFE over the past 15 years.
- From 2009-2024, the S&P 500® Index averaged returns of 14.7% annually vs. 8% for the MSCI EAFE, with lower volatility (14.9 vs. 16.2 standard deviation).
Index Return and Standard Deviation (2009-2024)
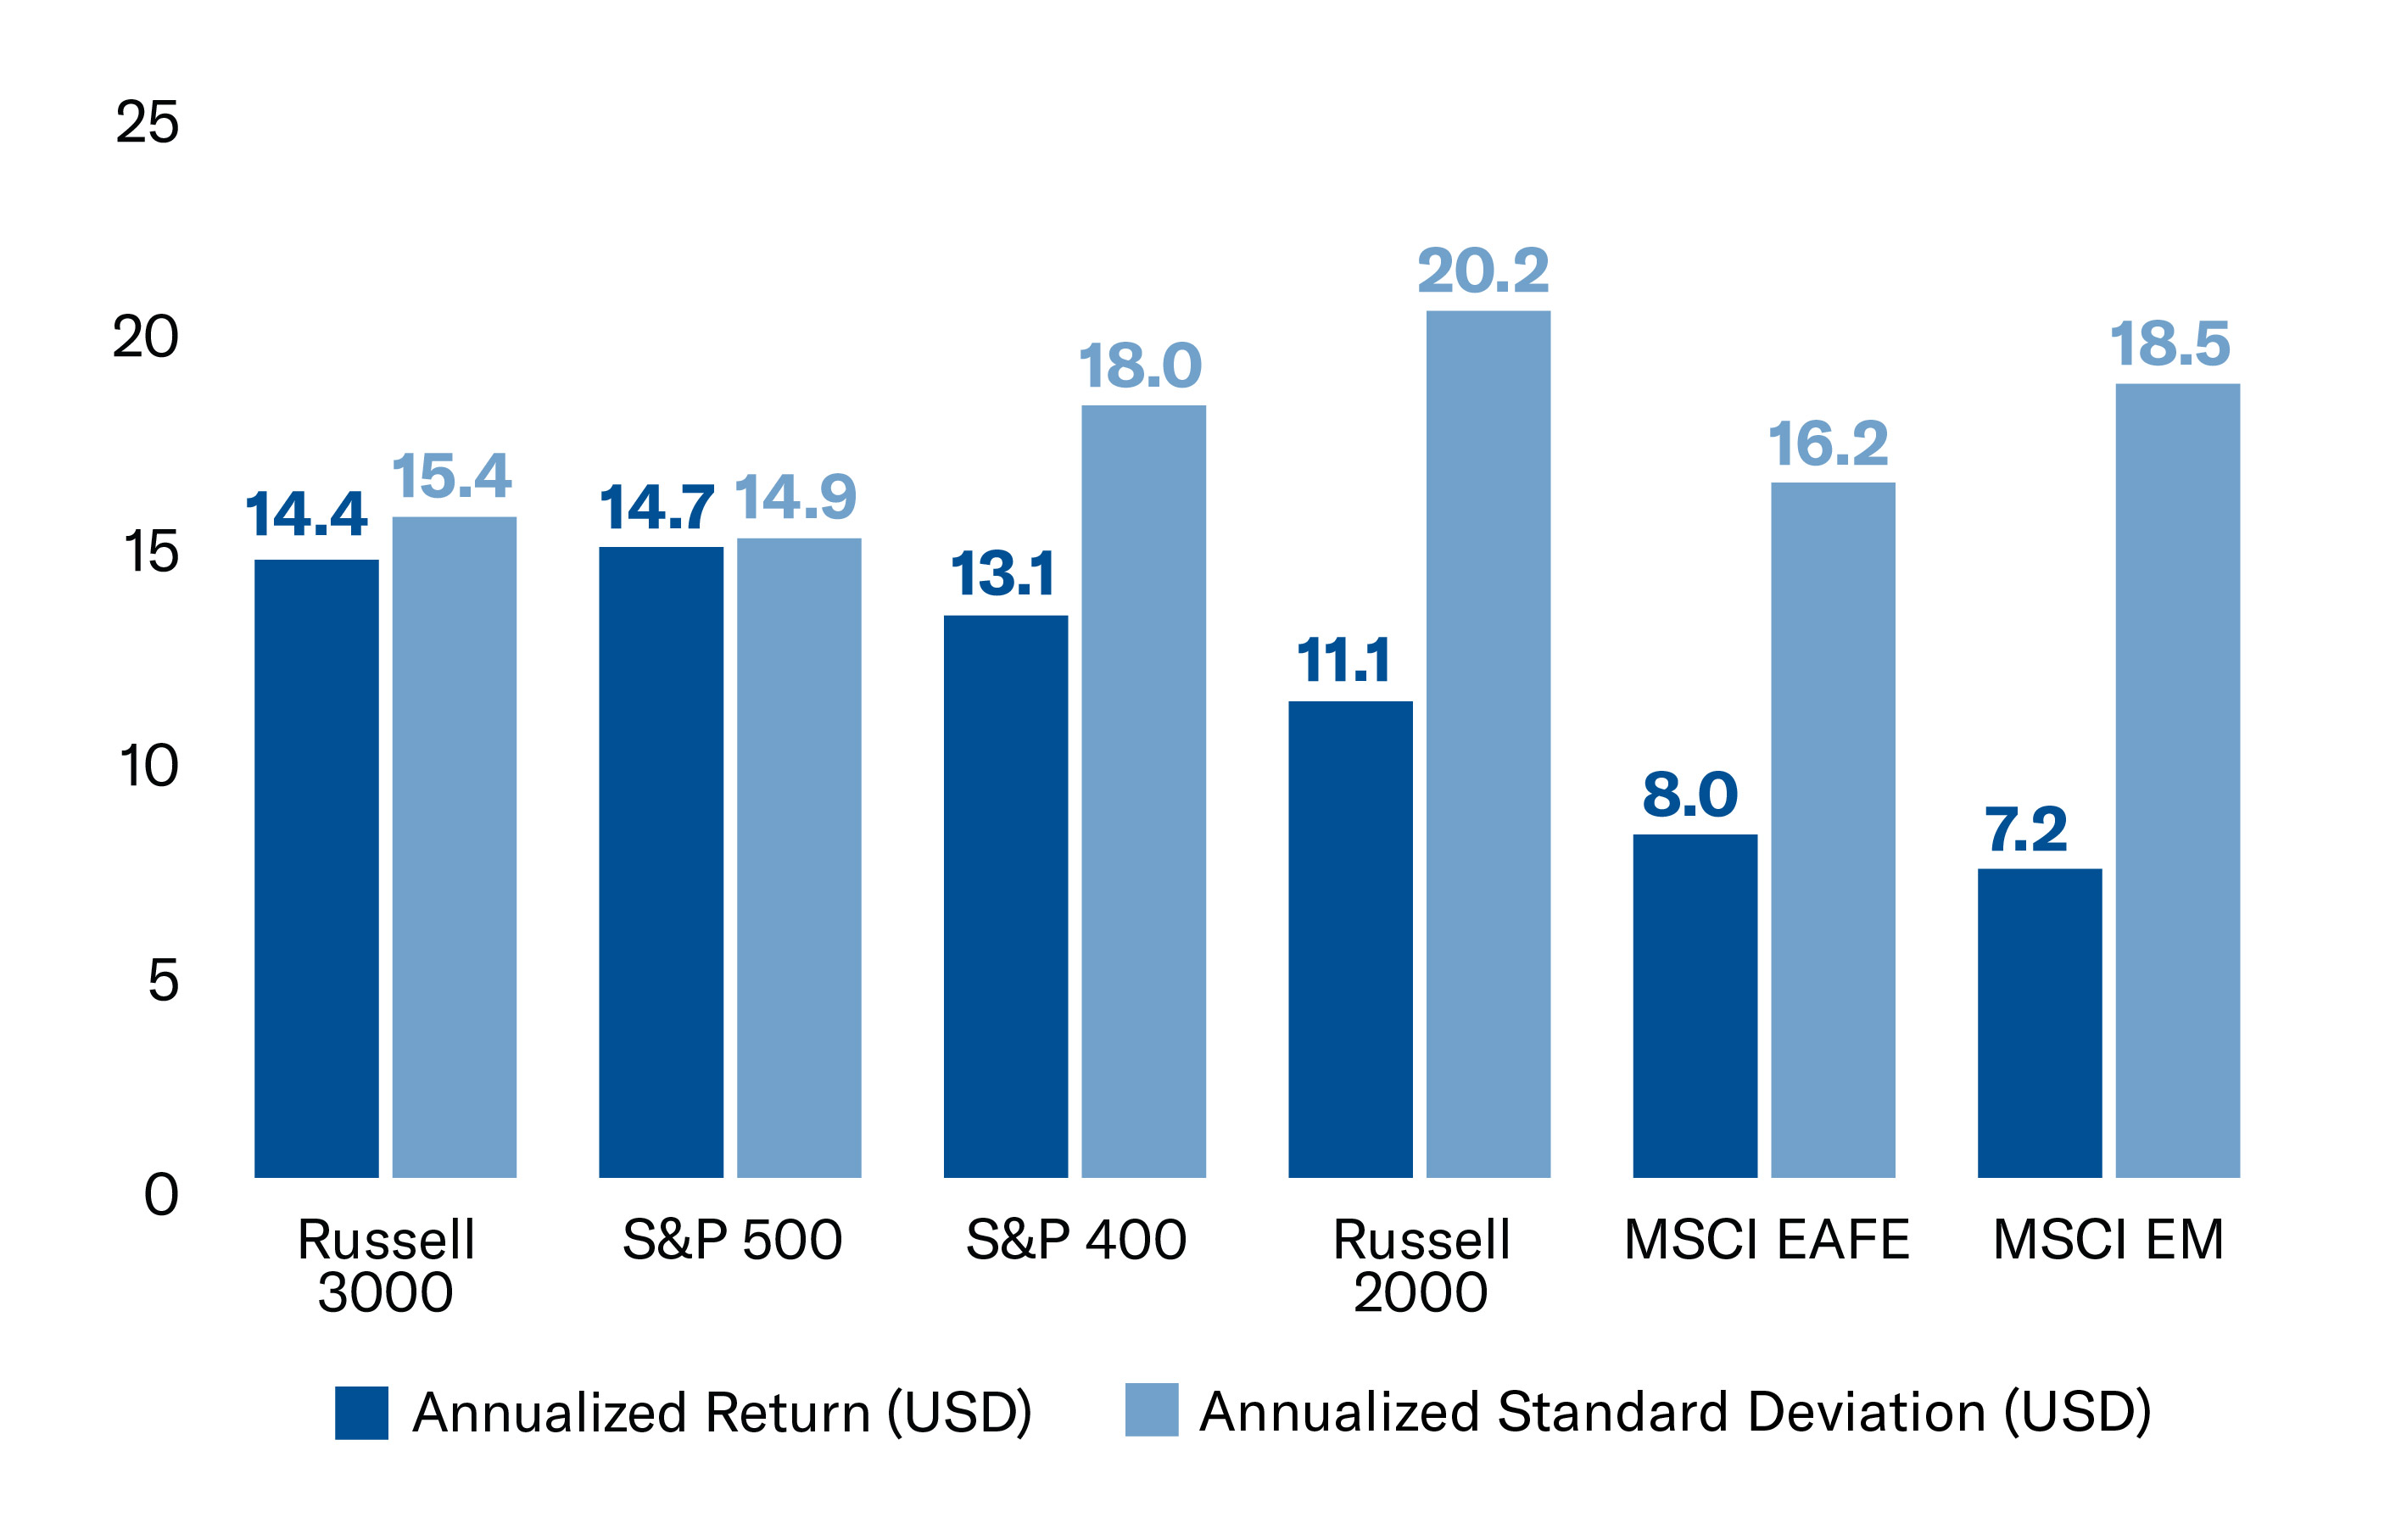
Source: FactSet Research Systems. Data from Jan 1, 2009-December 31, 2024.
Valuation Premium Justified by Fundamental
- Although EAFE is cheaper on a comparative basis, this reflects slower growth and less tech exposure than the US.
- U.S. markets have consistently traded at a valuation premium since 2010 while still outperforming, driven by stronger fundamentals, such as margins, sales growth and return on equity.
Region Fundamentals
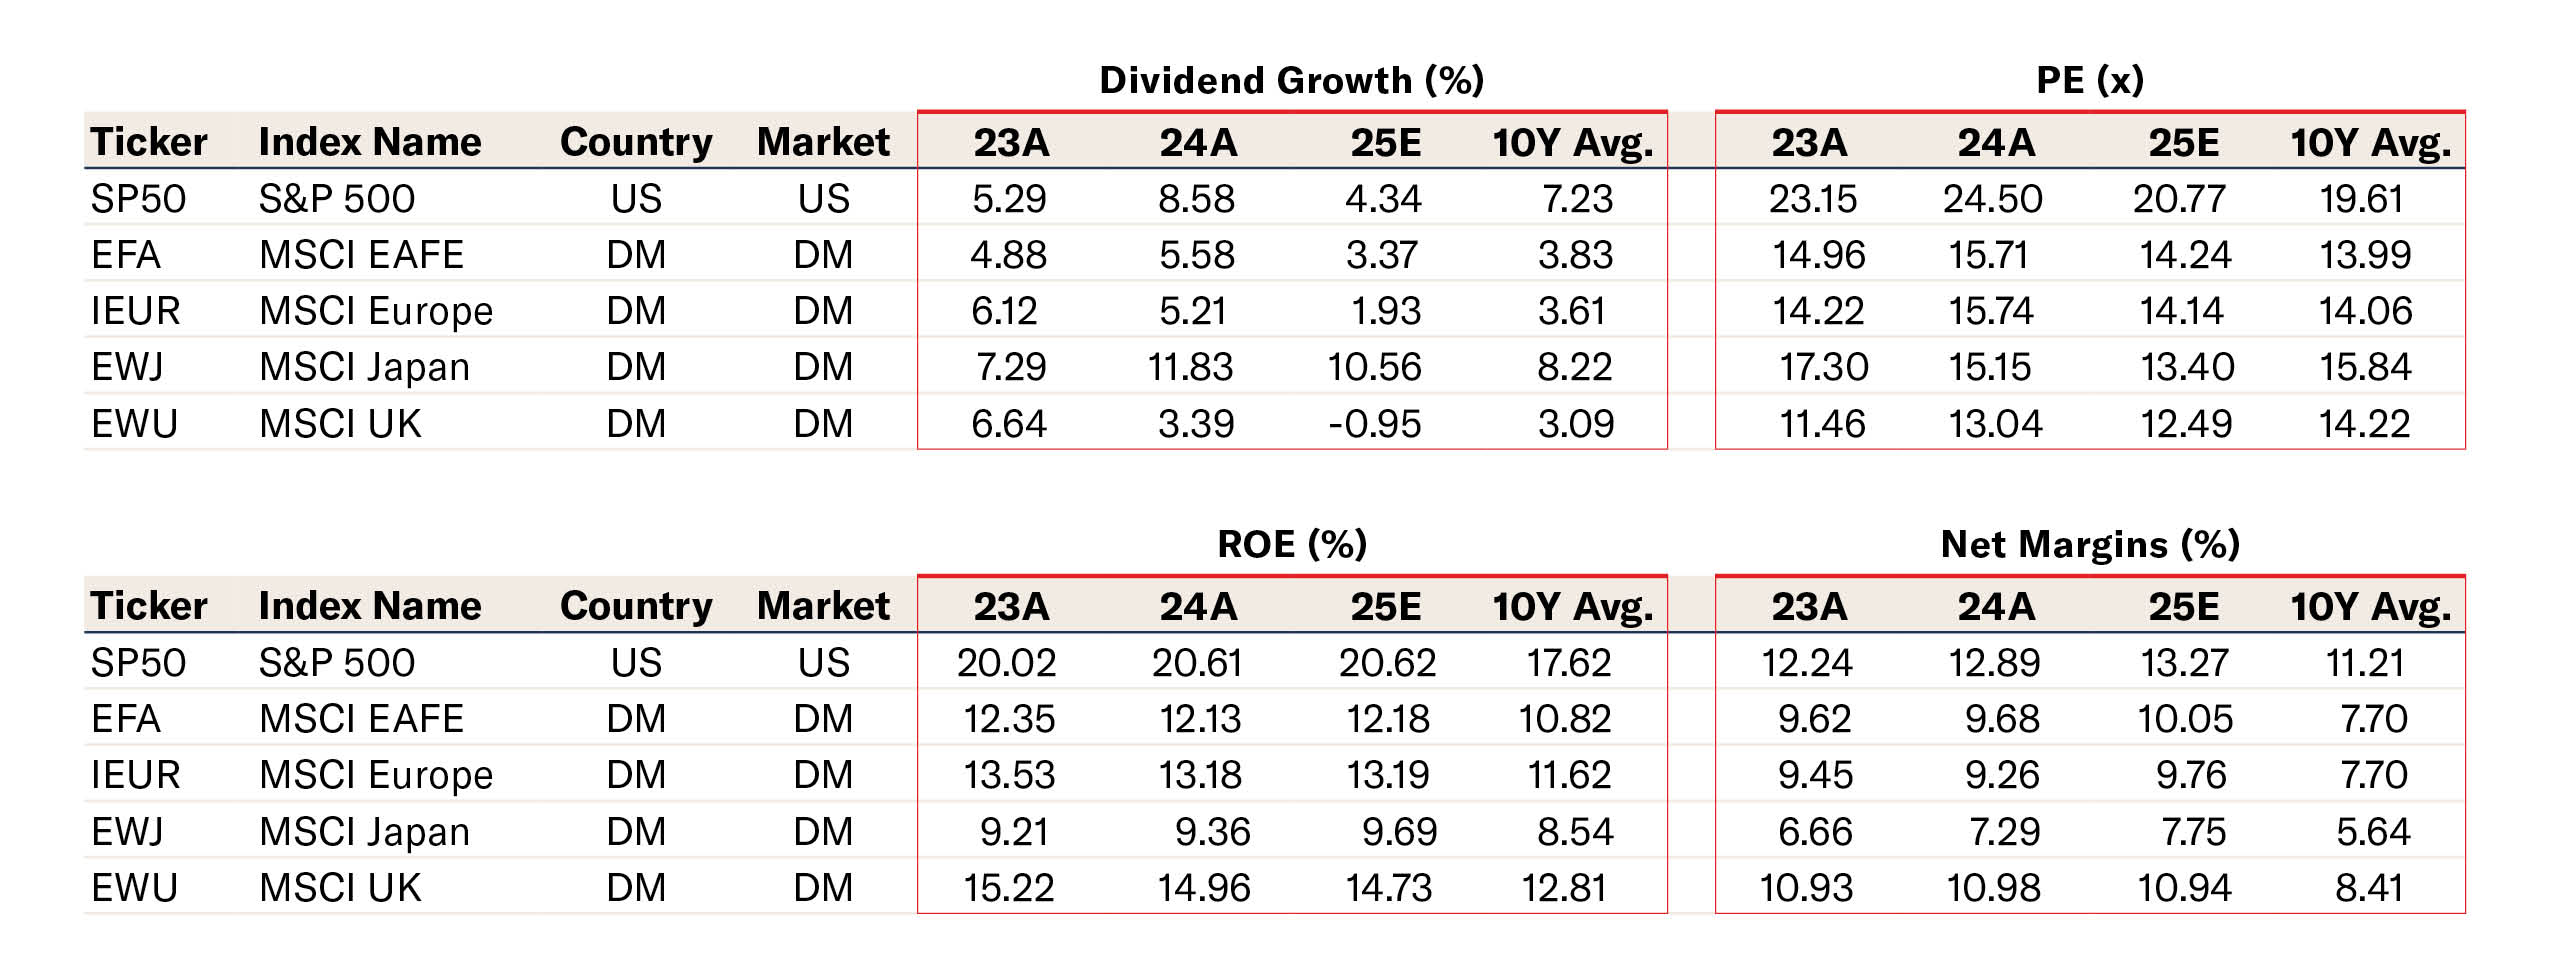
Source: FactSet Research Systems. Data as of 3/31/2025.
Superior Earnings and Sales
- The S&P 500 is projected to deliver double-digit EPS growth in 2025 versus modest or flat projections for European and Japanese indices.
- U.S. sales growth remains nearly double that of EAFE markets.
Region Earnings & Sales Growth
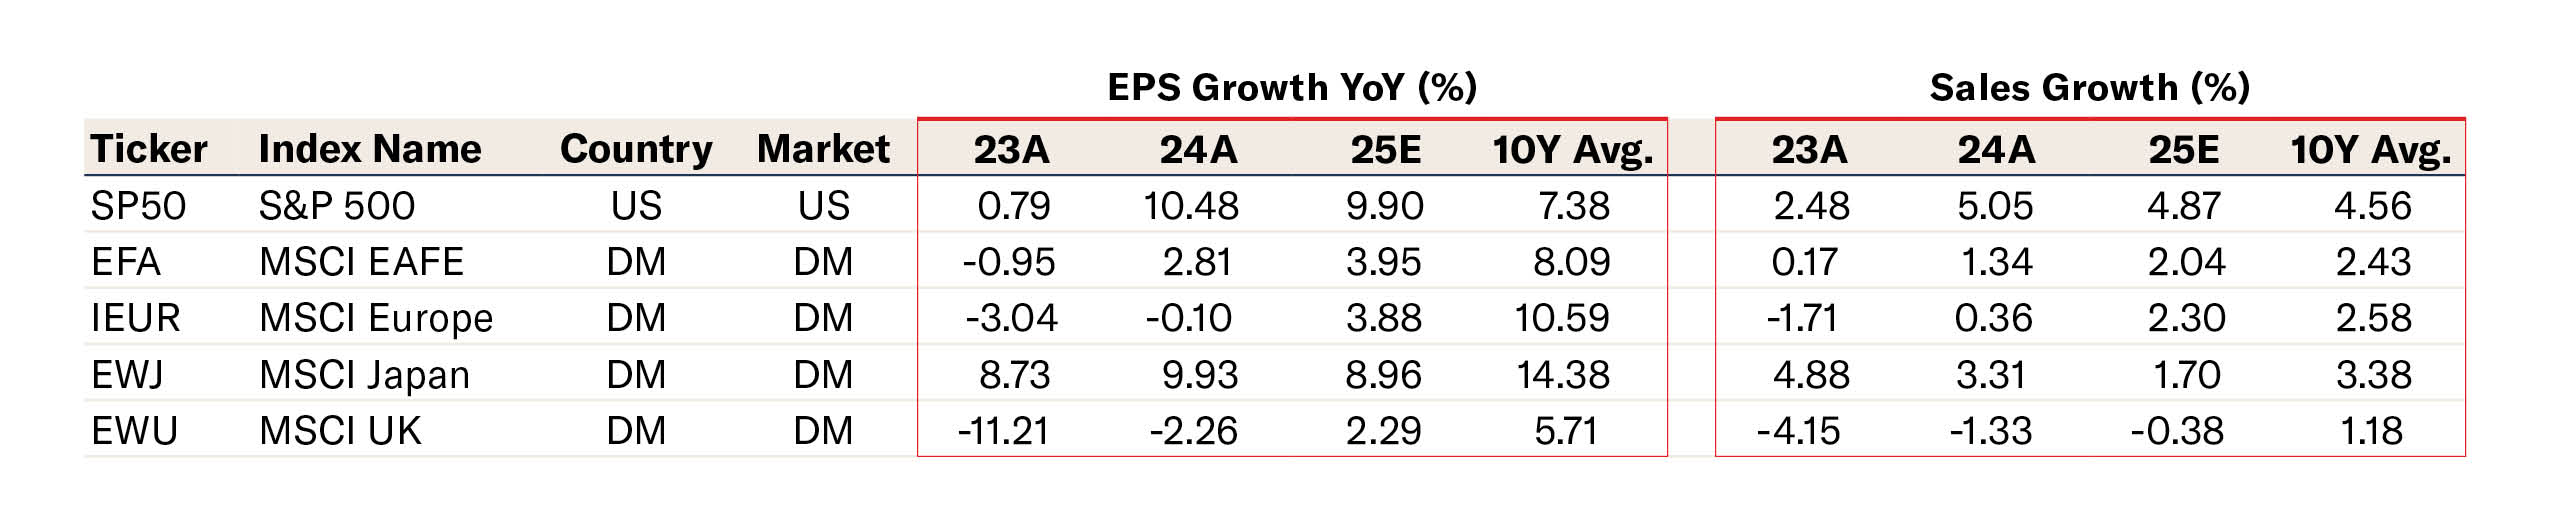
Source: FactSet Research Systems. Data as of 3/31/2025.
Sector Composition Advantage
- U.S. markets are weighted toward high-growth sectors like technology, AI, cloud computing and chip design.
- EAFE markets remain concentrated in value-oriented sectors—like financials, industrials and materials—with much less exposure to secular growth drivers.
Index Composition
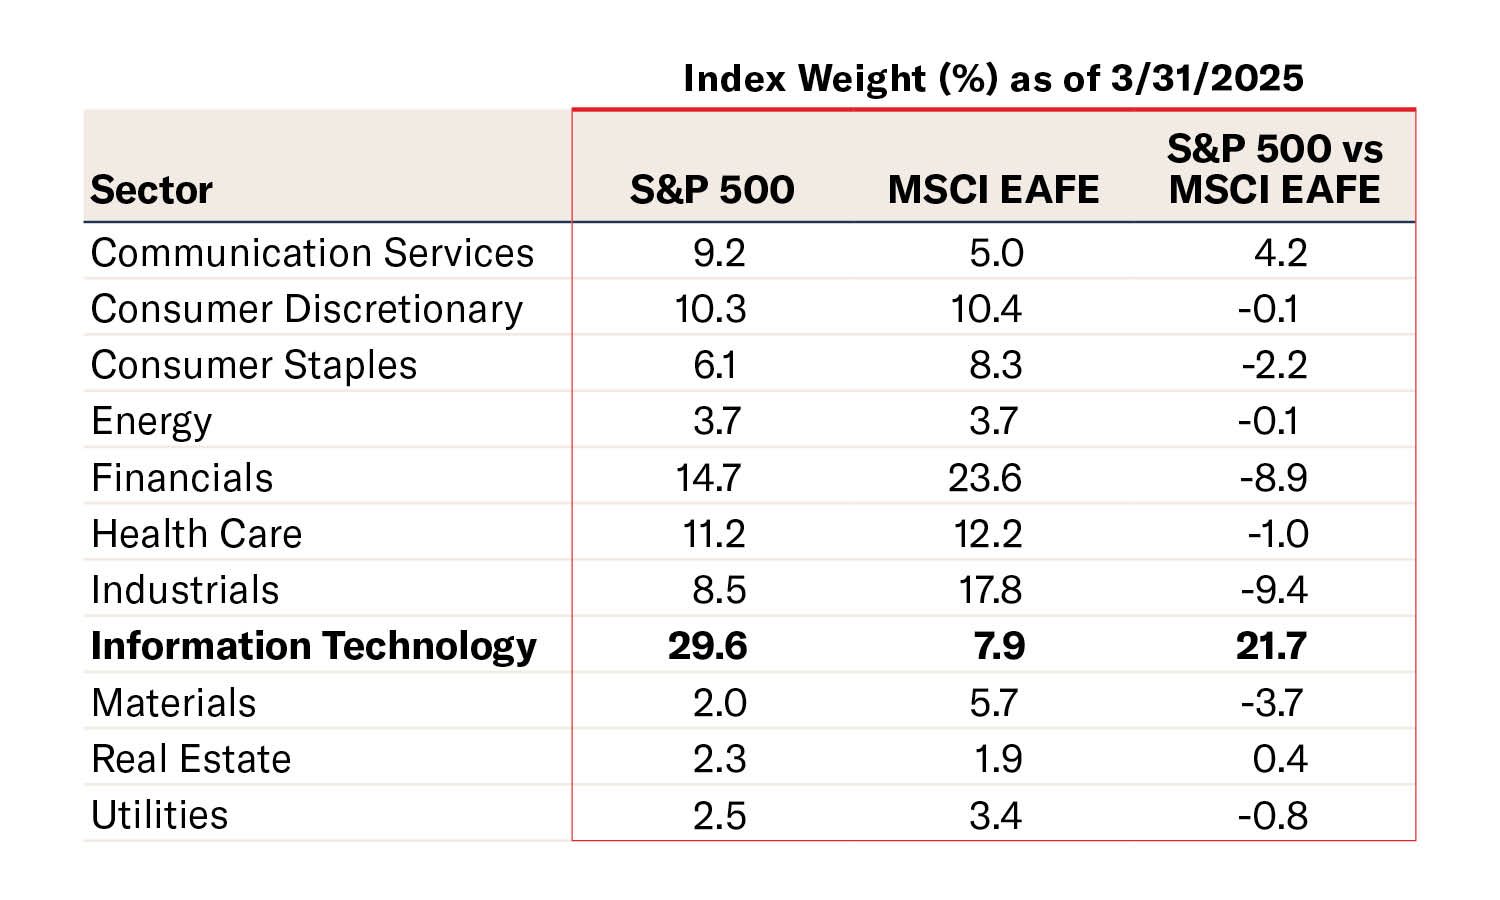
Source: FactSet Research Systems. Data as of 3/31/2025.
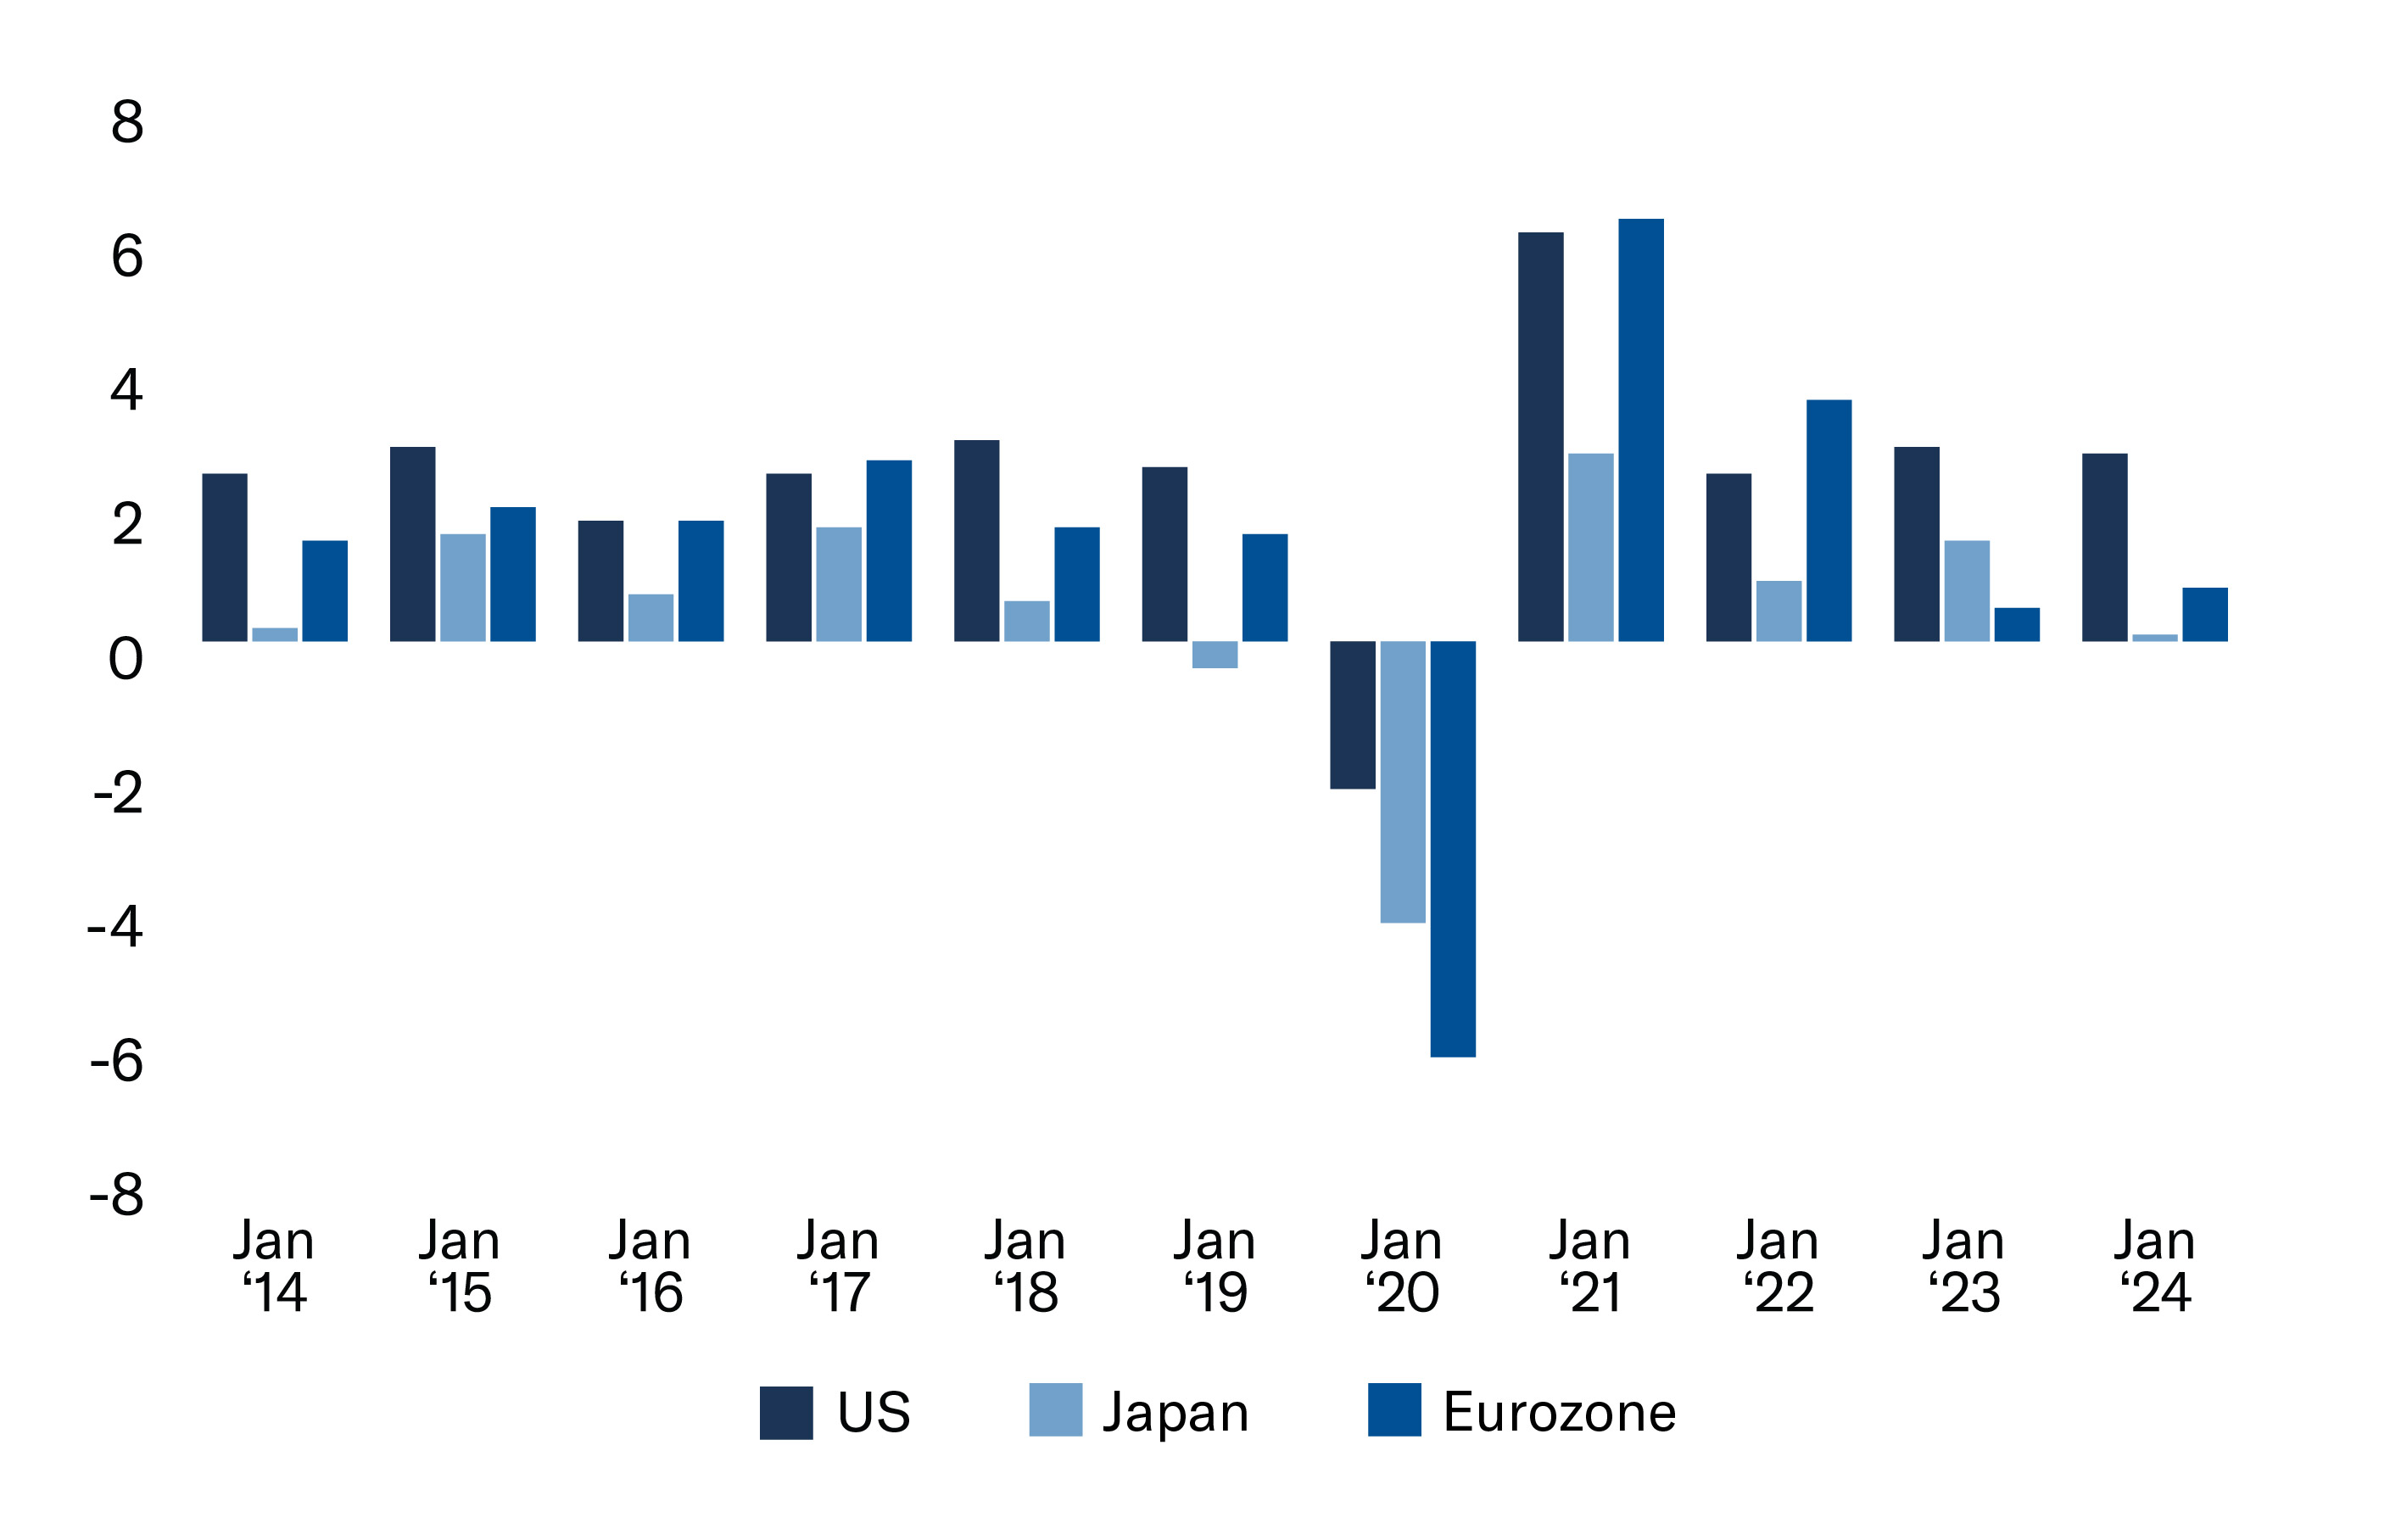
Economic and Demographic Resilience
- U.S. Gross Domestic Product (GDP) is stronger and more consistent.
- Resilient U.S. labor markets and consumer spending drive long-term stability.
Real GDP Year-over-year (2014-2024)
Source: FactSet Research Systems. Data as of 3/31/2025.
The U.S. remains the main driver of growth and value creation in global markets. Superior earnings, sector leadership and economic resilience support our conviction to stay overweight U.S. versus MSCI EAFE in our Asset Allocation portfolios.
Jamie Zendel is EVP, Head of Quantitative Strategies, at Mutual of America Capital Management LLC.
Past performance is no guarantee of future results. The index returns discussed above are for illustrative purposes only and do not represent the performance of any investment or group of investments. Indexes are unmanaged and not subject to fees or expenses. The index returns above reflect the reinvestment of distributions. It is not possible to invest directly in an index.
The views expressed in this article are subject to change at any time based on market and other conditions and should not be construed as a recommendation. This article contains forward-looking statements, which speak only as of the date they were made and involve risks and uncertainties that could cause actual results to differ materially from those expressed herein. Readers are cautioned not to rely on our forward-looking statements.
The information has been provided as a general market commentary only and does not constitute legal, tax, accounting, other professional counsel or investment advice, is not predictive of future performance, and should not be construed as an offer to sell or a solicitation to buy any security or make an offer where otherwise unlawful. The information has been provided without taking into account the investment objective, financial situation or needs of any particular person. Mutual of America is not responsible for any subsequent investment advice given based on the information supplied.
The information has been provided as a general market commentary only and does not constitute legal, tax, accounting, other professional counsel or investment advice, is not predictive of future performance, and should not be construed as an offer to sell or a solicitation to buy any security or make an offer where otherwise unlawful. The information has been provided without taking into account the investment objective, financial situation or needs of any particular person. Mutual of America is not responsible for any subsequent investment advice given based on the information supplied.
Mutual of America Capital Management LLC is an indirect, wholly owned subsidiary of Mutual of America Life Insurance Company. Insurance products are issued by Mutual of America Life Insurance Company, 320 Park Avenue, New York, NY 10022-6839. Mutual of America Securities LLC, Member FINRA/SIPC distributes securities products. Mutual of America Retirement Services LLC provides administrative and recordkeeping services. Mutual of America Financial Group is the trade name for the companies of Mutual of America Life Insurance Company.